What is smart energy management for those who must carry this out in several or thousands of buildings? The key here is energy analytics, with its first basic steps to detecting the greatest potential savings, and advanced analysis tools to achieve the level of detail that we want.
We’ll tell you what an advanced energy analysis should be like for a buildings portfolio, whatever their size, and how to detect the savings potential hidden in their buildings. Keep reading…
Energy Analytics for Building Portfolios
Energy analytics is the ability to perform an analysis on the consumption of any energy source (water, gas, fuel, electricity, thermal energy, etc.) and at all levels. From a generic overall level to the smallest detail, managing to analyse what has happened with each kWh consumed.
Energy analytics has three essential steps:
- Detecting savings as quickly and with the least investment possible
- Advanced analysis with tools to calculate indicators or ratios, analysis of activity times, consumption on public holidays, estimated consumption and costs at the end of the month or quarter, analysis of renewable sources, etc.
- Optimisation of your processes 24/7 to detect anomalies for you and and further optimise energy consumption.
These three steps answer important questions when managing the energy of a portfolio of buildings: How far do I have to go with the energy management plan? Do I install solar panels on all my buildings? Does it make sense to do this in all of them?
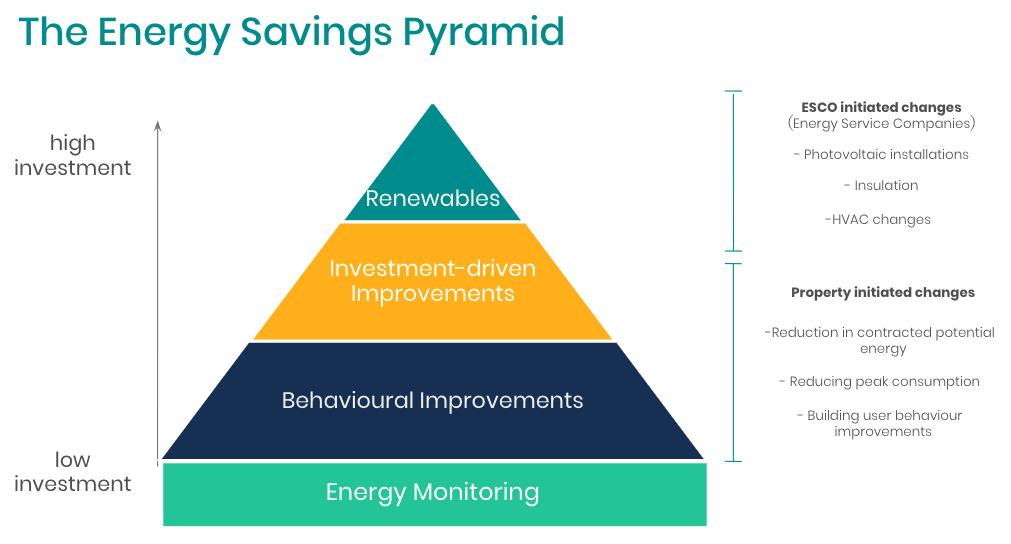
The answer to these questions is different for each company, but it helps to visualise the concept of the energy efficiency pyramid:
In this pyramid we see that the more sophisticated we want to be (renewables, demand response, etc.) the more investment will be needed. However, on the other hand, the return on investment will not only be greater but also faster. As soon as you implement the improvements in the highest part of the pyramid, you start to save, usually in a linear way.
Always bear in mind that once you reach the target set in your particular energy efficiency pyramid, you must demonstrate to your managers that you have reached that level of the pyramid to guarantee the project’s ROI. Therefore, it is vital that you have measurement and verification tools in your EMS, such as:
→ Being able to show the project’s results globally, automatically and quickly, that is, with a simple click.
→ Showing, in % values, the saving achieved compared to the targets set.
→ Automatic configuration of the measurement and verification of savings tool.
In this video you can see how the use of a measurement and verification tool such as the Spacewell Energy Platform (Dexma) can help you to graphically see the results of your projects and how they are developing. It is vital that any energy management software has such a tool.
Detect Savings Potential in Building Portfolios with Minimum Investment
Until now, the process for detecting potential energy savings was lengthy and expensive. Versions of energy audits were carried out, building by building, to see what was happening and where improvements could be made.
For the real estate or facility management company, this meant a high financial cost and it was also costly in terms of time (the results are not immediate).
Added to this factor is growing governmental pressure for transparency and comparative benchmarking between buildings.
Thanks to Big Data technology and artificial intelligence algorithms, nowadays there are other ways to detect potential energy savings in building portfolios.
Let us use the example of management having decided to reduce the global energy consumption of our portfolio by 15%.
Where do we start?
Which buildings have the most potential for improvement?
Will I be able to achieve the 15% target?
Until now, the most common thing was to begin with an energy audit of the entire property portfolio. An energy audit is a report that analyses consumption by properties and detects potential improvements. The costs can vary from €0.50 to €1 per square metre analysed, and the time it takes can fluctuate between 15 days and 6 months, depending on the detail we require. If we have a portfolio of 20,000 m2, we will have spent at least €10,000 and waited 6 months before we have enough information to start making decisions and we will still not have saved anything.
Fortunately, the world of Big Data and artificial intelligence has arrived in energy management and as a result of the large volume of data available, now there are tools that speed up the detection process, scanning the entire portfolio en masse, reducing costs by 90% and detecting improvements in 24-48 hours.


