According to statistics, 40% of the energy consumption in Europe comes from the building sector. This led the European Commission to create energy efficiency directives to improve the energy efficiency of buildings, introducing the concept of NZEB or Nearly Zero-Energy Buildings.
In this article, you will find out how much PV energy a building needs to become NZEB with a real example, and how to measure it.
One of the main measures to be implemented is the requirement for all new buildings from 2021 (public buildings from 2019) to be NZEB. Nevertheless, while the European Commission proposed an ambitious legislative framework for it, the definition of NZEB varies at a European scale.
Four different categories, defined at the national level by experts, can indeed be used to qualify a NZEB:
- Net zero energy buildings / Plus energy buildings.
- Nearly zero-energy buildings (NZEB) according to national definitions.
- Buildings with an energy performance better than the national requirements in 2012.
- Buildings constructed/renovated according to national minimum requirements in 2012.
For the purpose of our case study, we will consider a NZEB as a Net Zero Energy Building, which is a building with net zero energy consumption, meaning the total amount of energy used by the building on an annual basis is equal to the amount of renewable energy generated on-site.
The fact that the calculation is on a full-year basis is of great importance because the lower renewable energy production in winter can be compensated by the higher production in summer. This also implies that the building is grid-connected and thus doesn’t need any on-site storage system which, as of 2021, seems highly unfeasible for big buildings from an economic and technical point of view.
On the same note, if you want to learn more about NZEB and how they contribute to sustainable development, this article is a must read.
6 Reasons to Support NZEB Building Models
The benefits of planning or refurbishing a building to the NZEB standards are both economic and ecological:
- Lower energy consumption, thus lower operational costs.
- Higher independence from the electrical grid lessens the impact of increasing electricity prices.
- Revenue generation thanks to electricity reselling.
- Lower electricity peak demand leading to lower electricity tariffs.
- Lower building carbon emissions.
- Better interaction between the building and the electrical grid.
But transforming or planning a NZEB building means working on both fronts:
- Reduce the building’s electricity consumption
- Install on-site renewable energy systems
There are many ways to reduce energy consumption in buildings while the principal way to generate renewable energy is the installation of an on-site photovoltaic system, placed in most cases on the roof of the building.
While at the early stages of building-integrated photovoltaic, the systems were sized to maximise the on-site electricity generation, the energy exchange between the building and the energy infrastructure is more and more emphasised when sizing a PV system.
The fluctuating power generation of renewable energies can indeed be challenging for the electricity network which seeks to constantly balance the power generation and power consumption. This could explain why most of the financial incentives for PV systems are progressively putting the focus on maximising energy self-consumption instead of maximising energy production.
In fact, the buy-back rate for produced photovoltaic electricity is constantly decreasing while the electricity grid prices are constantly increasing.
But what does a NZEB building look like? Or how much PV does a building need to compensate for the annual energy consumption? And from a more global perspective, how do the energy grid and the building interact throughout the year?
For this purpose, we will examine three different cases generated with Spacewell Energy (Dexma)’s Building Energy Modelling (BEM) module, a module aimed to generate synthetic (but realistic) building energy consumption and production profiles.
Case Study – Energy Consumption in a Building Office in Madrid
Three cases will be generated employing BEM: a building without PV electricity, one with maximised, and another one with optimised PV electricity production. The building modelled is a five-storey (one lower and four upper) office located in Madrid, that has a thermal envelope corresponding to a building built in recent years. The office has a heat pump for the heating, a chiller for the cooling, and an electrical storage tank for domestic hot water production making the building only reliant on electricity from an energy standpoint. The building is mechanically ventilated with heat recovery ventilation. No energy-intensive appliances like data centres have been considered.
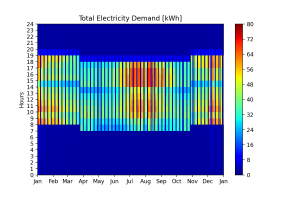
The following chart shows the hourly average consumption for every month of the year in a heatmap. The minimum consumption (dark blue) occurs in non-activity periods when the building is closed (at night).
On the other hand, the peak consumption occurs from 14 to 17h during summer when the solar radiation, occupancy and external temperature are at their highest. The 1h shift from April to October is due to the time shift (CET to CEST).
In the following comparison, we’ll examine the electricity exchange between the building and the grid.
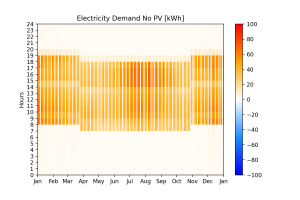
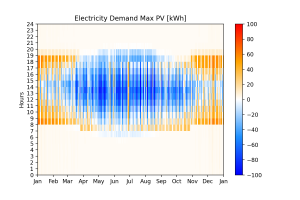
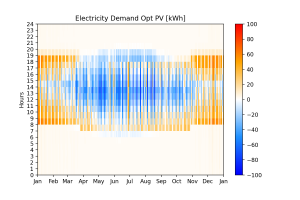
The reddish areas represent the hours when the energy is consumed from the grid, whereas the blueish ones represent the hours when electricity is injected into the grid thanks to the PV system. White areas represent the hours when the building’s electricity production compensates for the building’s electricity demand.
Case 1: Office without on-site PV electricity production
Let’s first consider this office without any renewable energy production, which was typical for buildings two decades ago.
The building is only dependent on the grid for its energy supply which isn’t surprising given the absence of PV-system.
Case 2: Office with maximised PV electricity production
In this case, we maximise the PV area on the roof. For our calculation hypothesis, we consider that the PV area can represent up to 80% of the roof area.
Given its significantly higher energy production than its energy consumption, this case would be a step further from a NZEB and would be a positive energy building (PEB).
The building is in fact producing 27% more energy than it is consuming. This is achieved thanks to the high PV energy yield in summer since the energy consumption remains higher than the production during the winter.
Case 3: Office with optimised PV production
In the last case, we reduce the maximised PV area by 27% (58% of the roof covered) to compensate for the annual total electricity consumption without aiming to generate additional electricity.
Being an NZEB, this building would probably have a lesser impact on the energy grid in summer by not overloading it when the grid-electricity demand is low.
In countries favouring self-consumption in their financial incentives, this sizing may also be more profitable than the maximised PV area scenario thanks to its higher solar energy self-consumption ratio.
How to Improve my Building Towards a NZEB?
Several factors will influence the technical and economic feasibility of transforming your building into a NZEB. On one hand, some improvements will help to lower the building energy demand, such as:
- Improving the building fabric (lower windows U-value, better insulation, improved solar shading),
- Improving the loads (lighting technology),
- And improving the HVAC systems (higher efficiencies, reduced operation time, heat recovery and free-cooling).
On the other hand, the energy production of PV systems is mainly dependent on the local climate (solar radiation) and the covered surface area.
Given the variety of factors influencing both demand and energy production, finding the right formula for balancing the former with the latter in a profitable manner can be quite challenging.
That’s why Spacewell Energy (Dexma)’s platform offers a way to find appropriate solutions using its Detect module. This module was conceived to seek profitable building energy refurbishments and profitable renewable energy systems for many types of buildings, based on their energy consumption measurement.
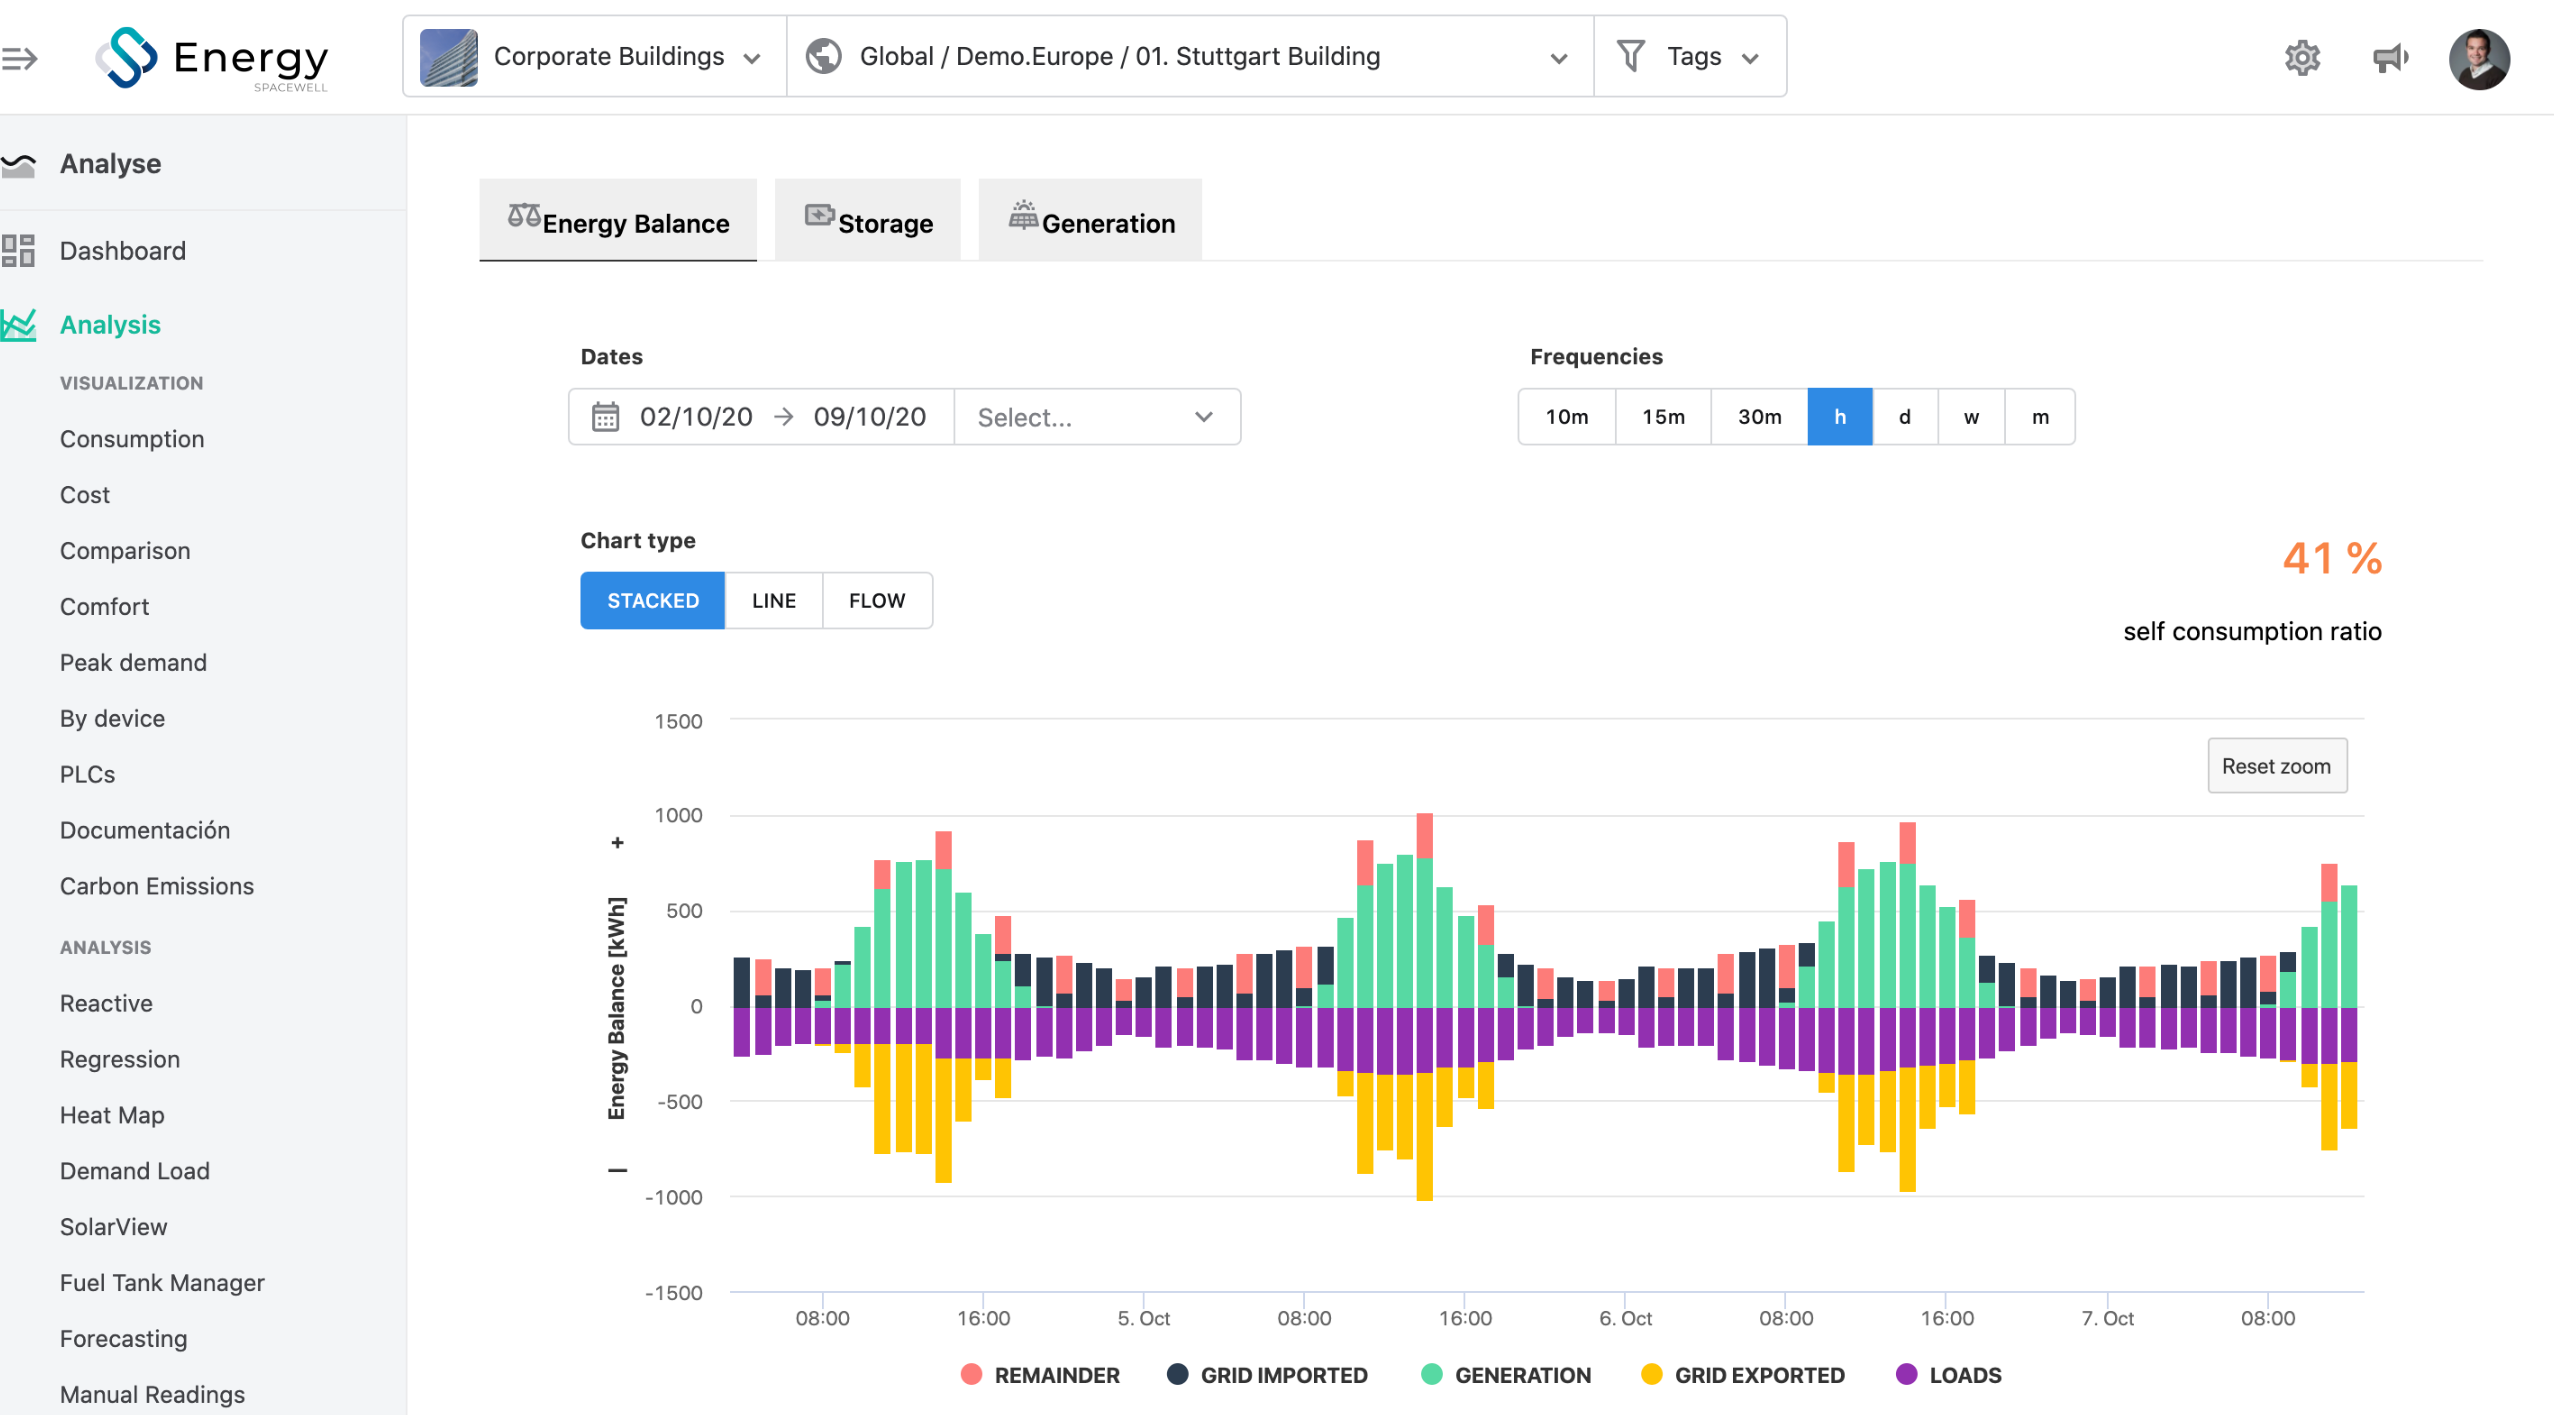
Spacewell Energy (Dexma) Detect calculates and sizes potential Solar PV plants in rooftops at scale, in a matter of minutes:
The Microgrid feature integrated within Spacewell Energy (Dexma) Analyse will then track your building’s renewable energy production and energy consumption, helping to reach your NZEB targets. (If you want to know more about microgrids and how to manage them from the platform, take a look at this Webinar).
Editor’s note – This article has been written by two of Spacewell Energy (Dexma)’s former leading experts in energy management software:


